One Article Review
| Source | |
|---|---|
| Identifiant | 3025400 |
| Date de publication | 2021-07-05 17:15:28 (vue: 2021-07-05 22:05:27) |
| Titre | Some quick notes on SDR |
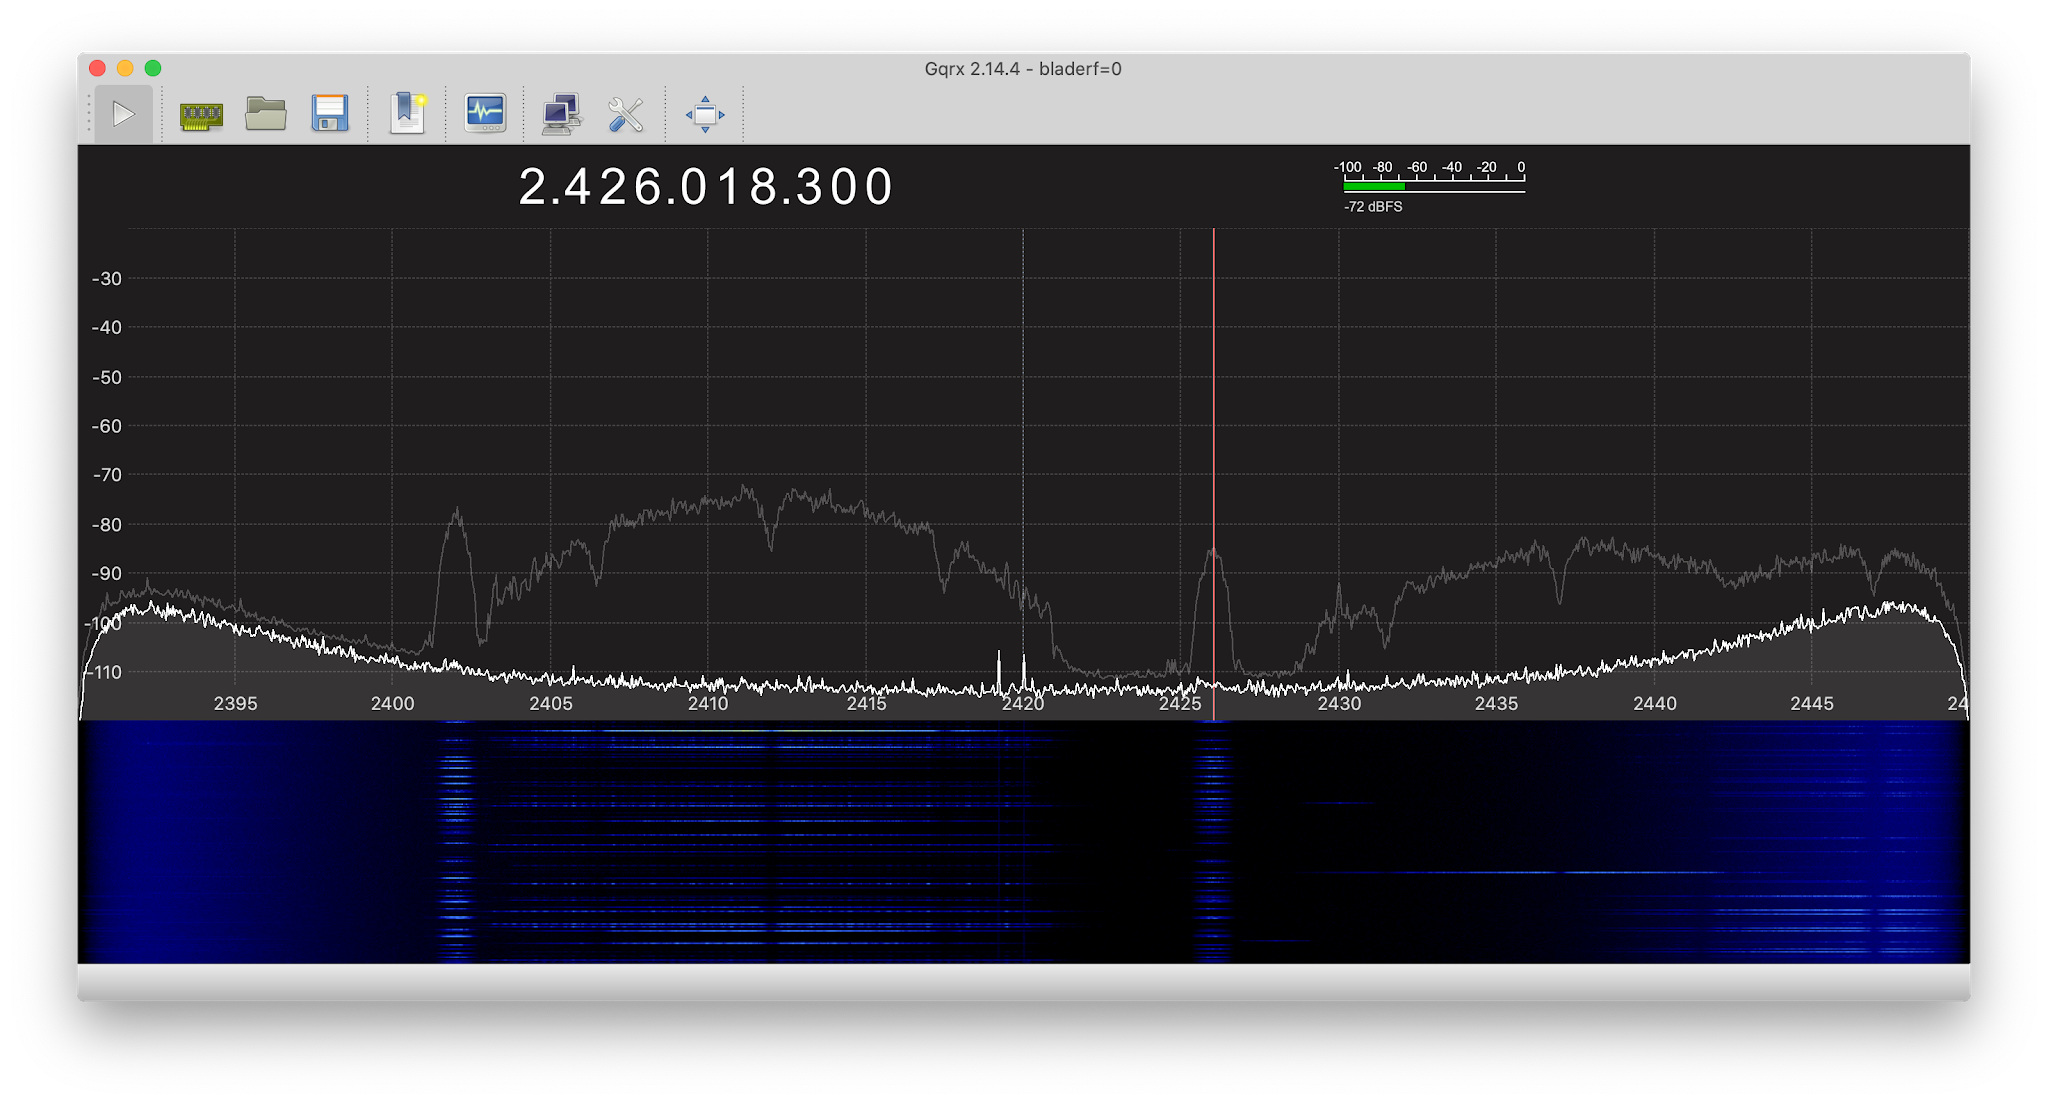
| Texte | I'm trying to create perfect screen captures of SDR to explain the world of radio around us. In this blogpost, I'm going to discuss some of the imperfect captures I'm getting, specifically, some notes about WiFi and Bluetooth.An SDR is a "software defined radio" which digitally samples radio waves and uses number crunching to decode the signal into data. Among the simplest thing an SDR can do is look at a chunk of spectrum and see signal strength. This is shown below, where I'm monitoring part of the famous 2.4 GHz pectrum used by WiFi/Bluetooth/microwave-ovens: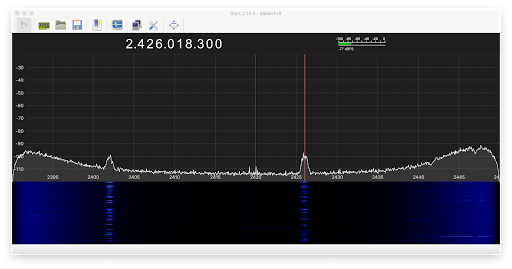 There are two panes. The top shows the current signal strength as graph. The bottom pane is the "waterfall" graph showing signal strength over time, display strength as colors: black means almost no signal, blue means some, and yellow means a strong signal.The signal strength graph is a bowl shape, because we are actually sampling at a specific frequency of 2.42 GHz, and the further away from this "center", the less accurate the analysis. Thus, the algorithms think there is more signal the further away from the center we are.What we do see here is two peaks, at 2.402 GHz toward the left and 2.426 GHz toward the right (which I've marked with the red line). These are the "Bluetooth beacon" channels. I was able to capture the screen at the moment some packets were sent, showing signal at this point. Below in the waterfall chart, we see packets constantly being sent at these frequencies.We are surrounded by devices giving off packets here: our phones, our watches, "tags" attached to devices, televisions, remote controls, speakers, computers, and so on. This is a picture from my home, showing only my devices and perhaps my neighbors. In a crowded area, these two bands are saturated with traffic.The 2.4 GHz region also includes WiFi. So I connected to a WiFi access-point to watch the signal. There are two panes. The top shows the current signal strength as graph. The bottom pane is the "waterfall" graph showing signal strength over time, display strength as colors: black means almost no signal, blue means some, and yellow means a strong signal.The signal strength graph is a bowl shape, because we are actually sampling at a specific frequency of 2.42 GHz, and the further away from this "center", the less accurate the analysis. Thus, the algorithms think there is more signal the further away from the center we are.What we do see here is two peaks, at 2.402 GHz toward the left and 2.426 GHz toward the right (which I've marked with the red line). These are the "Bluetooth beacon" channels. I was able to capture the screen at the moment some packets were sent, showing signal at this point. Below in the waterfall chart, we see packets constantly being sent at these frequencies.We are surrounded by devices giving off packets here: our phones, our watches, "tags" attached to devices, televisions, remote controls, speakers, computers, and so on. This is a picture from my home, showing only my devices and perhaps my neighbors. In a crowded area, these two bands are saturated with traffic.The 2.4 GHz region also includes WiFi. So I connected to a WiFi access-point to watch the signal.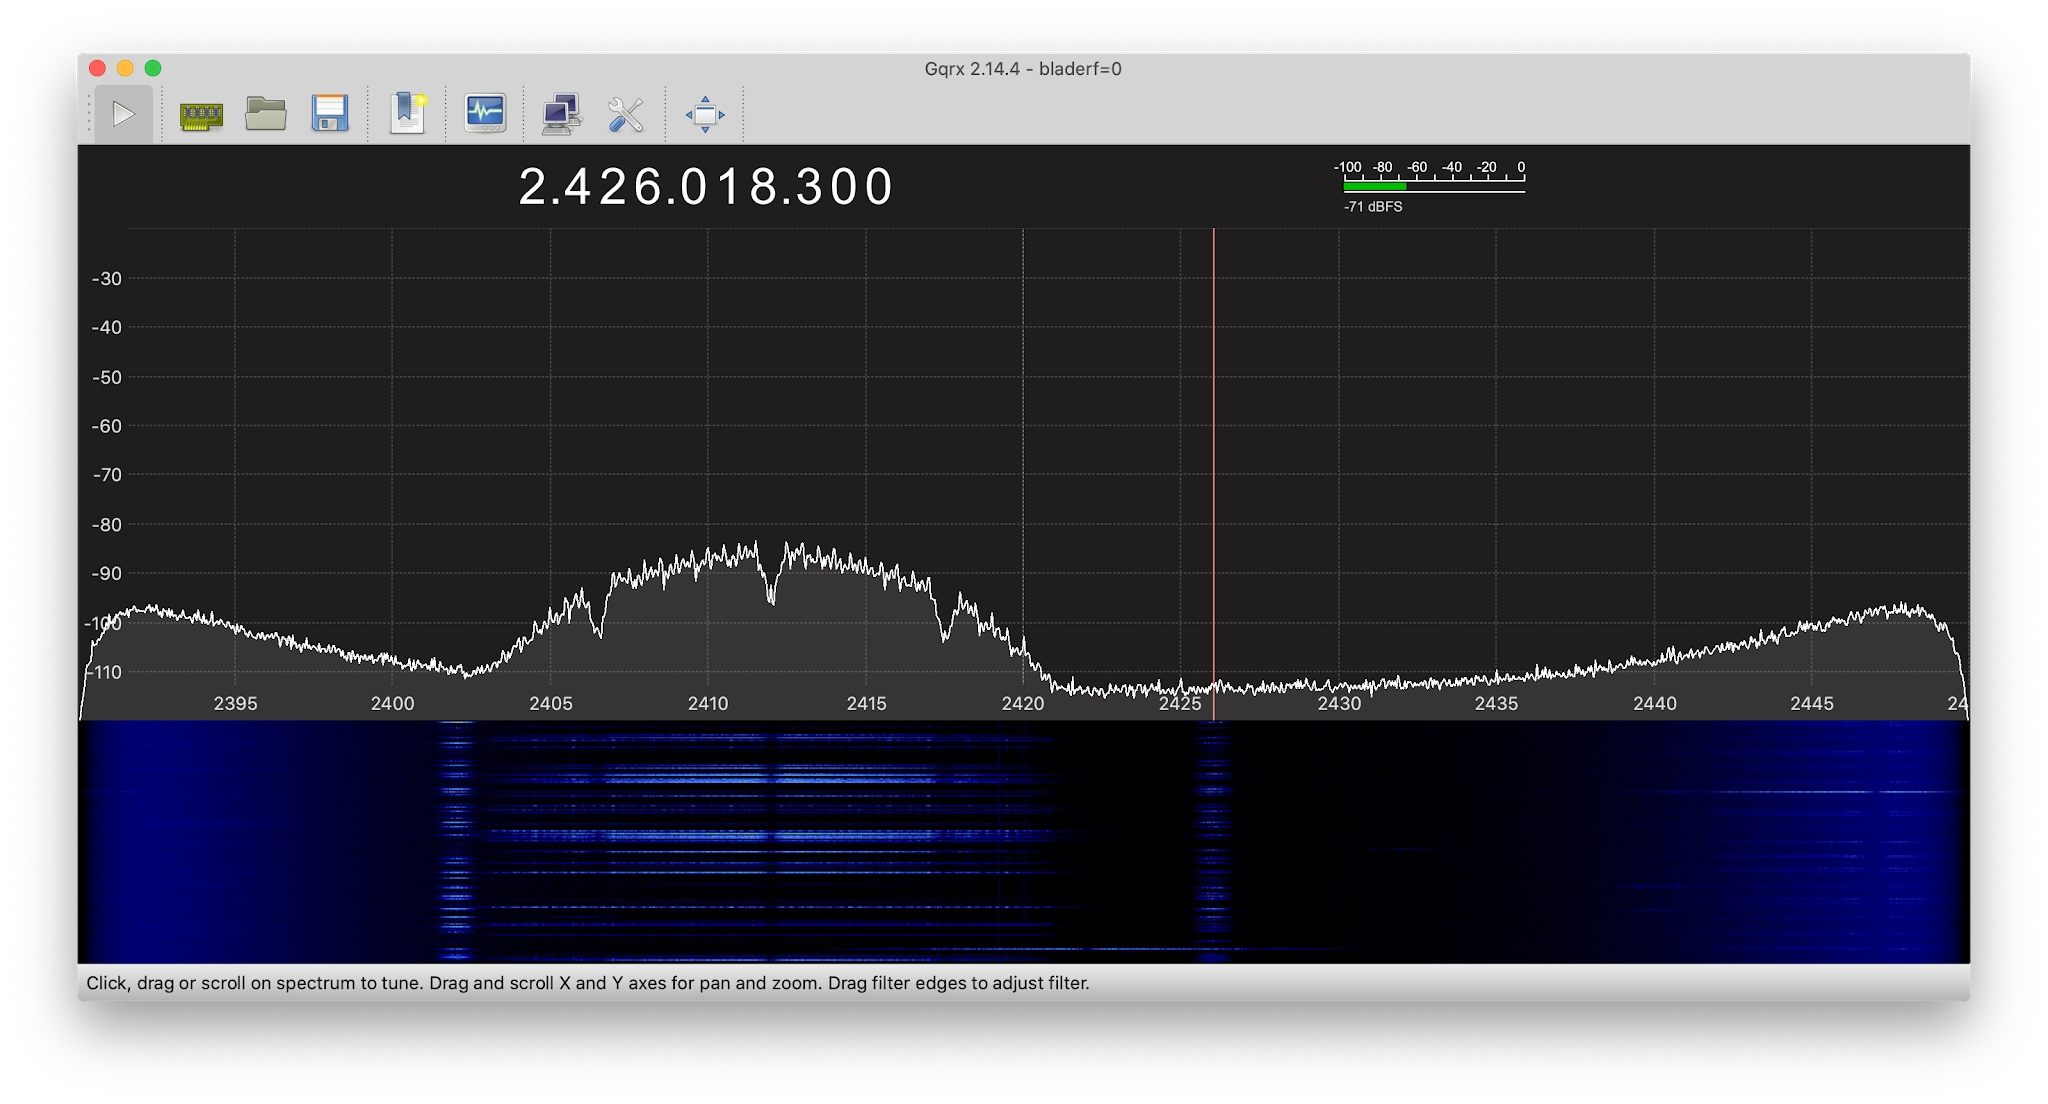 WiFi uses more bandwidth than Bluetooth. The term "bandwidth" is used today to mean "faster speeds", but it comes from the world of radio where it quite literally means the width of the band. The width of the Bluetooth transmissions seen above is 2 MHz, the width of the WiFi band shown here is 20 MHz.It took about 50 screenshots before getting these two. I had to hit the "capture" button right at the moment things were being transmitted. And easier way is a setting that graphs the current signal strength compared to the maximum recently seen as a separate line. That's shown below: the instant it was taken, there was no signal, but it shows the maximum of recent signals as a separate line: WiFi uses more bandwidth than Bluetooth. The term "bandwidth" is used today to mean "faster speeds", but it comes from the world of radio where it quite literally means the width of the band. The width of the Bluetooth transmissions seen above is 2 MHz, the width of the WiFi band shown here is 20 MHz.It took about 50 screenshots before getting these two. I had to hit the "capture" button right at the moment things were being transmitted. And easier way is a setting that graphs the current signal strength compared to the maximum recently seen as a separate line. That's shown below: the instant it was taken, there was no signal, but it shows the maximum of recent signals as a separate line: |
| Envoyé | Oui |
| Condensat | 11b 11n 11n:instead 160 402 412 426 437 447 802 able about above access accurate achieved across actually aim algorithms all almost also altered among analysis another antenna antennas anyway apart are area around array arrays assigned attached away band bands bandwidth based beacon beam because before being below below: better between black block blogpost blue bluetooth bottom bowl box box: but button called can cancel cannot capture captures center change channel channels chart chunk circuits colors: comes commonly compared computers connected constantly controls create creating crowded crunching current curve curved data decode defined devices difference different digitally direction directional directions discuss dish dishes display doubles doubling each earth easier edges effect effective efficiently encode entire even exceed explain famous fancy fast faster fills fixed floor frequencies frequency from fully further generating gets getting ghz give given giving going governs graph graphs had has height here here: higher highlight hit home houses how imperfect inaccurate includes increase increasing increasingly instant instead interesting internet its keep known latest left less like limit limits line line:you literally look low lte marked math maximum mean means measure measured mentioned mhz mimo mimo: minimum mobile moment monitoring more mostly move multiple near neighbor neighbors new newer noise not notes notice now number off old one ones only orbit other out ovens:there over overhead overlapping packets pane panes part peaks pectrum perfect perhaps phased phases phone phones physics picture pictures point pointed possible produce quick quite radio radios reason receiving recent recently red region reinforce remote right same samples sampling satellite satellites saturated scheme screen screenshots sdr see seen sent separate set setting shannon shape should showing shown shows signal signals simplest simply size slightly software solution some something space spacex speakers specific specifically spectrum speed speeds splits square standard starlink straight strength strong stronger strongest such surrounded tags take taken televisions term than that them theoretical these thing things think thus time times timing today too took top toward traffic transmissions transmit/receive transmitted travel trying two use used uses using very wanted watch watches waterfall waves way weaker what when where which whizzing why wide width wifi wifi/bluetooth/microwave works world yagi yellow |
| Tags | |
| Stories | |
| Notes | |
| Move | |
L'article ne semble pas avoir été repris aprés sa publication.
L'article ne semble pas avoir été repris sur un précédent.