One Article Review
| Source | |
|---|---|
| Identifiant | 8598204 |
| Date de publication | 2024-10-15 14:00:00 (vue: 2024-10-15 15:16:54) |
| Titre | À quel point pouvez-vous aller?Une analyse des tendances du temps à exploiter 2023 How Low Can You Go? An Analysis of 2023 Time-to-Exploit Trends |
| Texte | Written by: Casey Charrier, Robert Weiner
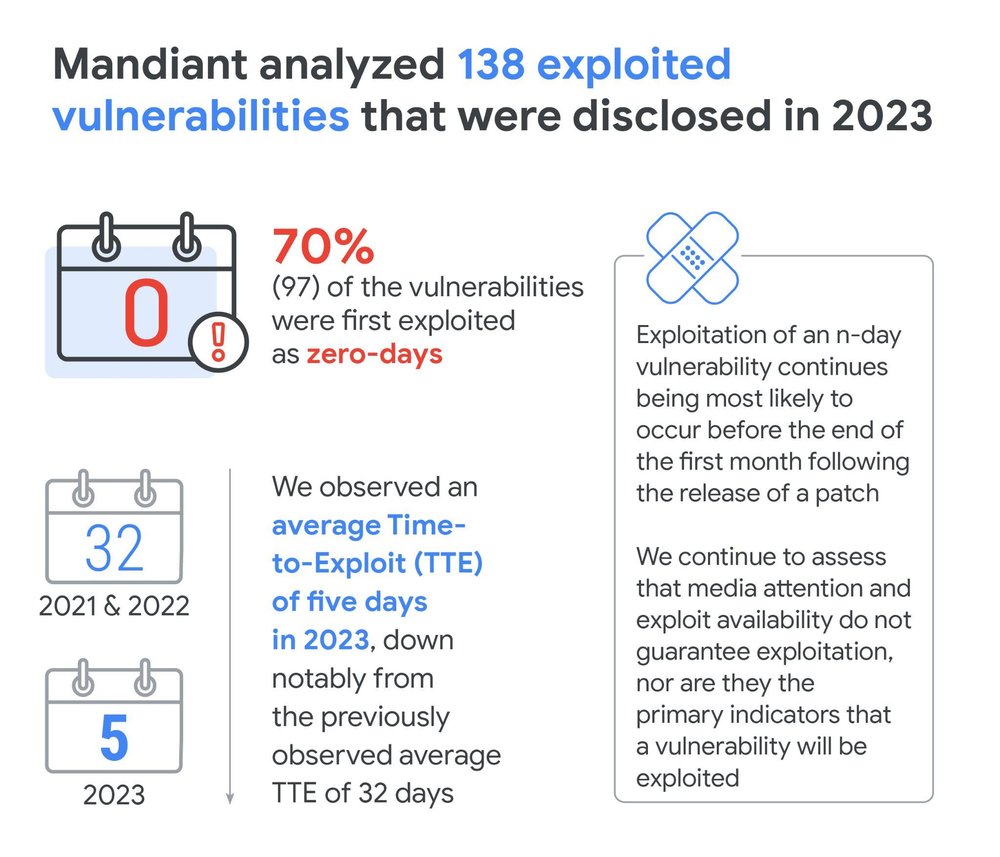 Mandiant analyzed 138 vulnerabilities that were disclosed in 2023 and that we tracked as exploited in the wild. Consistent with past analyses, the majority (97) of these vulnerabilities were exploited as zero-days (vulnerabilities exploited before patches are made available, excluding end-of-life technologies). Forty-one vulnerabilities were exploited as n-days (vulnerabilities first exploited after patches are available). While we have previously seen and continue to expect a growing use of zero-days over time, 2023 saw an even larger discrepancy grow between zero-day and n-day exploitation as zero-day exploitation outpaced n-day exploitation more heavily than we have previously observed.
While our data is based on reliable observations, we note that the numbers are conservative estimates as we rely on the first reported exploitation of a vulnerability. Frequently, first exploitation dates are not publicly disclosed or are given vague timeframes (e.g., "mid-July" or "Q2 2023"), in which case we assume the latest plausible date. It is also likely that undiscovered exploitation has occurred. Therefore, actual times to exploit are almost certainly earlier than this data suggests.
Exploitation Timelines
Time-to-Exploit
Time-to-exploit (TTE) is our metric for defining the average time taken to exploit a vulnerability before or after a patch is released. Historically, our analyses have seen reduced times-to-exploit year over year. Through 2018 to 2019, we observed an average TTE of 63 days. From 2020 to the start of 2021, that number decreased to 44 days. Then, across all of 2021 and 2022, the average observed TTE dropped further to 32 days, already half of our first tracked TTE starting in 2018. In 2023, we observed the largest drop in TTE thus far, with an average of just five days. This is less than a sixth of the previously observed TTE.
Our average TTE excludes 15 total data points, including two n-days and 13 zero-days, that we identified as outliers from a standard deviation-based statistical analysis. Without the removal of these outlier TTEs, the average grows from five to 47.
Zero-Day vs. N-day Exploitation
Prior to 2023, we had observed steady ratios of n-days to zero-days, being 38:62 across 2021–2022 and 39:61 across 2020 into part of 2021. However, in 2023, this ratio shifted to 30:70, a notable departure from what we had observed previously. Given that zero-day exploitation has risen steadily over the years, the shifting ratio appears to be influenced more from the recent increase in zero-day usage and detection rather than a drop in n-day usage. It is also possible that actors had a larger number of successful attempts to exploit zero-days in 2023. Future data and analyses will show whether this is the start of a
Mandiant analyzed 138 vulnerabilities that were disclosed in 2023 and that we tracked as exploited in the wild. Consistent with past analyses, the majority (97) of these vulnerabilities were exploited as zero-days (vulnerabilities exploited before patches are made available, excluding end-of-life technologies). Forty-one vulnerabilities were exploited as n-days (vulnerabilities first exploited after patches are available). While we have previously seen and continue to expect a growing use of zero-days over time, 2023 saw an even larger discrepancy grow between zero-day and n-day exploitation as zero-day exploitation outpaced n-day exploitation more heavily than we have previously observed.
While our data is based on reliable observations, we note that the numbers are conservative estimates as we rely on the first reported exploitation of a vulnerability. Frequently, first exploitation dates are not publicly disclosed or are given vague timeframes (e.g., "mid-July" or "Q2 2023"), in which case we assume the latest plausible date. It is also likely that undiscovered exploitation has occurred. Therefore, actual times to exploit are almost certainly earlier than this data suggests.
Exploitation Timelines
Time-to-Exploit
Time-to-exploit (TTE) is our metric for defining the average time taken to exploit a vulnerability before or after a patch is released. Historically, our analyses have seen reduced times-to-exploit year over year. Through 2018 to 2019, we observed an average TTE of 63 days. From 2020 to the start of 2021, that number decreased to 44 days. Then, across all of 2021 and 2022, the average observed TTE dropped further to 32 days, already half of our first tracked TTE starting in 2018. In 2023, we observed the largest drop in TTE thus far, with an average of just five days. This is less than a sixth of the previously observed TTE.
Our average TTE excludes 15 total data points, including two n-days and 13 zero-days, that we identified as outliers from a standard deviation-based statistical analysis. Without the removal of these outlier TTEs, the average grows from five to 47.
Zero-Day vs. N-day Exploitation
Prior to 2023, we had observed steady ratios of n-days to zero-days, being 38:62 across 2021–2022 and 39:61 across 2020 into part of 2021. However, in 2023, this ratio shifted to 30:70, a notable departure from what we had observed previously. Given that zero-day exploitation has risen steadily over the years, the shifting ratio appears to be influenced more from the recent increase in zero-day usage and detection rather than a drop in n-day usage. It is also possible that actors had a larger number of successful attempts to exploit zero-days in 2023. Future data and analyses will show whether this is the start of a |
| Notes | ★★★ |
| Envoyé | Oui |
| Condensat | 138 2018 2019 2020 2021 2021–2022 2022 2023 27997 28121 30:70 38:62 39:61 |
| Tags | Tool Vulnerability Threat Patching Cloud Technical |
| Stories | |
| Move | |
L'article ne semble pas avoir été repris aprés sa publication.
L'article ne semble pas avoir été repris sur un précédent.